Now that lockdown measures are lifting, it is important to pick a strategy which will prevent a second epidemic wave (a rebound). It is estimated that only a very small share of the population is currently immune (between 3 and 7% of the French population for example on 11th May), which is not enough to talk about herd immunity.
Because herd immunity is not achievable quickly and without a high human cost (we tackle this issue in Q16), we should have a system where infected people self-isolate to avoid contaminating other people (similarly to the strategy adopted at the beginning of the epidemic or in Sweden, instead of the total lockdown, cf. Q13). However, this might not be enough. Since the incubation time with COVID-19 is long (a week on average, but sometimes up to 20 days), infected people have the time to infect their contacts before they are detected and put in quarantine. This is why we plan on tracking and tracing contracts (cf. Q14). Besides, the share of asymptomatic cases is still mostly unknown but estimated around 30%, which means that we cannot rely entirely on symptomatic displays to isolate infected people. It is therefore necessary to test the population more broadly.
The World Health Organisation (WHO) was already advocating this strategy on 16th May, recommending that we test all suspicious cases. France however started testing late and slowly: it took some time to design reliable tests and the small number of such available tests was thus limited to healthcare workers and people at risk. For more details about the different types of test, see Going further at the bottom of this page.
We now have better quality tests, but in order to successfully lift the lockdown measures, we will have to broaden the testing conditions. The goal of the French government is to be able to test 700,000 people per week. For now, France never tested more than 150,000 people per week, so the goal of 700,000 seems too ambitious for several reasons:
- the lack of Personal Protective Equipment (PPE), testing kits, staff;
- the limited number of non-medical laboratories requisited to administer the tests, which are under-used compared to medical laboratories;
- the lack of connections between the testing laboratories and the government database in order to centralise results.
Testing robots have been ordered to China to increase the testing capacity, but operating them requires staff who to be recruited and trained. These robots also consume a lot of consumable and delivery times are very long. It will thus take some time before we reach this testing capacity. Also, with France’s 67 million citizens, it would take about two years (96 weeks) to test everyone at this rate. This is way too long, given that a person tested negative on one given week can become sick the next week.
The goal is therefore twofold: we want to know as precisely as possible what is the current state of the epidemic in the country and we want to control the spread of the virus as well as possible with adapted measures (neither too strong nor too lax), under the constraint that testing kits are in limited supply. The question then is: who should we test in priority?
If we pick the people we test at random, given the small share of people infected in the total population, we risk having very few positive tests and “wasting” them (the chances of finding infected people are low). For this reason, we tend to test suspicious cases (the symptomatic ones), but this strategy ignores all the asymptomatic cases who are also contagious, and most probably numerous. At the beginning of the epidemic, healthcare workers were tested in priority, since they were the most exposed to the virus. As it aims to reopen schools, the government considers testing teachers and school workers. More generally, we should test people who work outside of home and therefore have a higher chance of being infected. But you can also be contaminated outside of work (when shopping for example). Since we now know the profile of high-risk people, we could also consider testing them in priority in order to treat them early and prevent serious complications. But the results would then not be representative of the general circulation of the epidemic in the general population.
It is clear that finding the best strategy on all accounts is not easy if only using our intuition. A simulation can help, by allowing us to compare different strategies and to measure their effects.
In our model
Characteristics of the population
We have modelled a population of 2,000 individuals, distributed in several age categories. This influences their sensitivity to the virus (people at-risk) as well as their mobility. For instance, 50% of people aged 20 to 65 have work outside their home (“essential” workers) whereas the rest stay at home (remote work, furloughed workers, family carers, etc.). People aged < 20 and 65+ are considered homebound (by respectively remote schooling and retirement).
Individuals in our population can be in one of five distinct states regarding the virus, as shown in the figure below:
- Susceptible: they have never been infected and are therefore not immune either
- In incubation: they have been infected but are not yet sick (it lasts 6 days on average)
- Asymptomatic: they are sick but display no symptom. Only a test will reveal them (30% of patients below 65, for an average of 21 days)
- Symptomatic: they are sick and display symptoms. (70% of patients below 65 and 100% of 65+ patients, for an average of 21 days)
- Recovered: they are immune and cannot get infected again (this is a hypothesis of this model, we do not know yet if it is the case in reality).
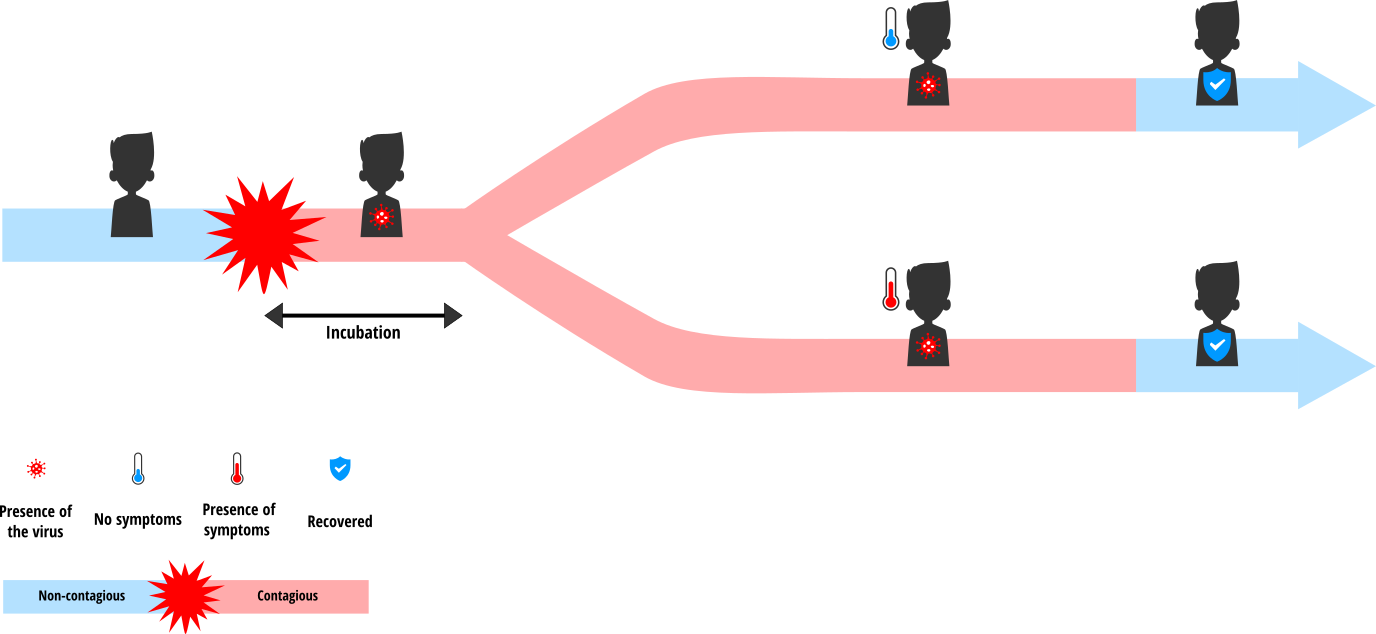
When they move in the simulation world, individuals can come into contact with one another. Infected people (in incubation, asymptomatic and symptomatic) are all contagious and can therefore transmit the virus to susceptible people they are in contact with. Individuals working from home do not move but they can be in contact with people passing by their home (deliveries, postal services, etc.). However, they have less contacts on average than people who have to work outside of home.
Testing strategies
Our goal is to find out how we can best use the tests available each day to reach the two main objectives of a massive testing campaign: to monitor the epidemic and to control it. In the model, we can act on several parameters:
- The number of tests available each day: the testing strategy of the French government plans for 500,000 to 700,000 tests per week, which corresponds to about 2 to 3 tests per day for the population of 2,000 in our model
- When the testing campaign starts, i.e. the moment from which we start testing the population. It is defined in the model by the threshold X of the proportion of symptomatic people in the population: when more than X% of the population is symptomatic, we start the testing campaign.
- The population being tested: do we pick individuals at random? Do we aim for symptomatic people, or older people (since they are more at risk), or people working outside of home?
In order to reduce the spread of the virus, people who tested positive are put into quarantine and are completely isolated: they cannot transmit the virus any further.
Inference of the epidemic curve
Using the number of tests performed, we can reconstruct the curve of the number of cases: the number of positive tests in the total number of tests provides an estimation of the proportion of cases in the general population. One of the advantages of our model is that we know the “true” number of people infected over time since we know the status of all of the agents. We can therefore compare the estimated curve using tests and the “true” curve to verify the correctness of the estimations.
In order to compute this estimation, we could intuitively think that a simple cross multiplication suffices: for instance, if we test 700,000 people and that 1,000 of them are infected, then we deduce that out of the 70,000,000 residents of France, 100,000 are infected. But this simple proportionality rule does not work well in epidemiology, especially when the number of people tested or the prevalence of the epidemic (i.e. the total number of cases at a given time) is too low, as is the case at the beginning and at the end of an epidemic, or when tests are not entirely reliable. Another method for estimating the total number of infected people is to compute the predictive values of the test, which depend on three elements: the prevalence of the epidemic, the rate of false positives and the rate of false negatives obtained with the test.
The number of confirmed cases given each day by the French government is a combination of the test results and the expertise of health professionals, since we do not know the “true” number of infected people (as we do in simulation). The computation method is more complex than the one we use in our model, which is a simplification of reality, but it also has, like all statistical estimations do, some error margins and potential biases.
Testing scenarios for 2,000 individuals
Comparison of estimated cases for the different samples of population
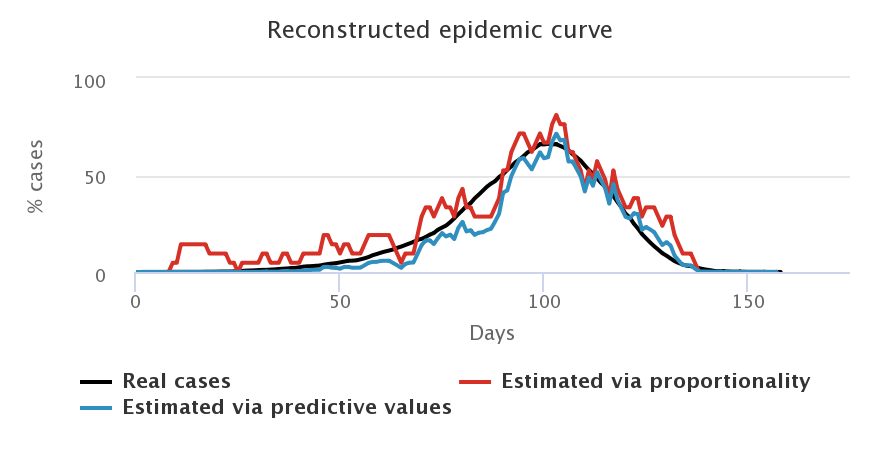
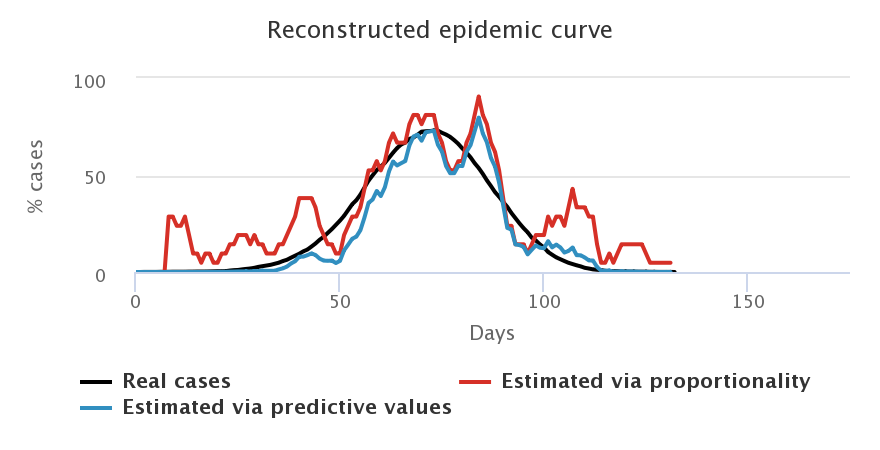
Let us look at what happens when we choose a daily number of cases equivalent to that of the French government, i.e. 3 tests for 2,000 individuals, and when we start testing as soon as the first case appears. We compare the curves representing the number of cases estimated by the proportionality rule (in red), the number of cases estimated by computing the predictive values (in blue) and the “true” number of cases (in black), for each sample of population.
| By testing at random | By testing symptomatic people |
|---|---|
| By testing elderly people | By testing people who work outside of home |
|---|---|
Firstly, we note that the blue and red curves (the estimated cases) vary a lot more than the black curves (the “true” cases). Indeed, they depend on the number of positive tests each day, which varies greatly depending on who is tested. In general, we choose to “smooth” this estimation by computing the mean result of tests over several days (here, a mean over 7 days), but there is always a larger variability depending on who is tested each week. For example, a lot of negative tests may result in an estimation of a decreasing epidemic which is not necessarily true (maybe we just tested non-infected people, which does not mean that no one is sick anymore).
We also note that the blue curves (with predictive values) are better estimators than the red curves (proportionality rule), especially at the beginning and at the end of the epidemic when the prevalence of the virus is low, and especially for symptomatic people, who are less representative of the total population.
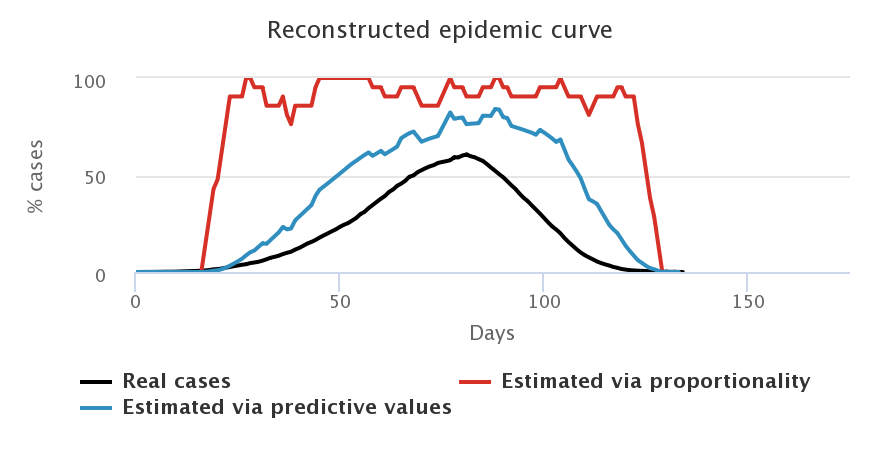
Secondly, we find that the worst estimation happens when we only test symptomatic people (top right figure): since we only test symptomatic people, who therefore have a high probability of being infected by COVID-19, we overestimate the “true” number of cases in the general population. Given that the tests we model are diagnostic ones, it is really not sound to extrapolate the number of cases in the general population from the tests performed on symptomatic people. The model confirms this. Such tests allow to control the epidemic by confirming and confining infected people, but they do not allow to monitor its spread in the population.
Comparison given the number of daily available tests
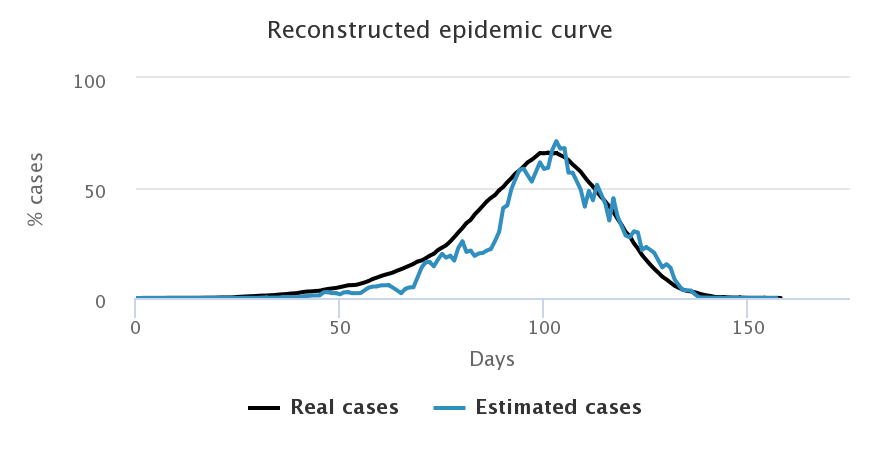
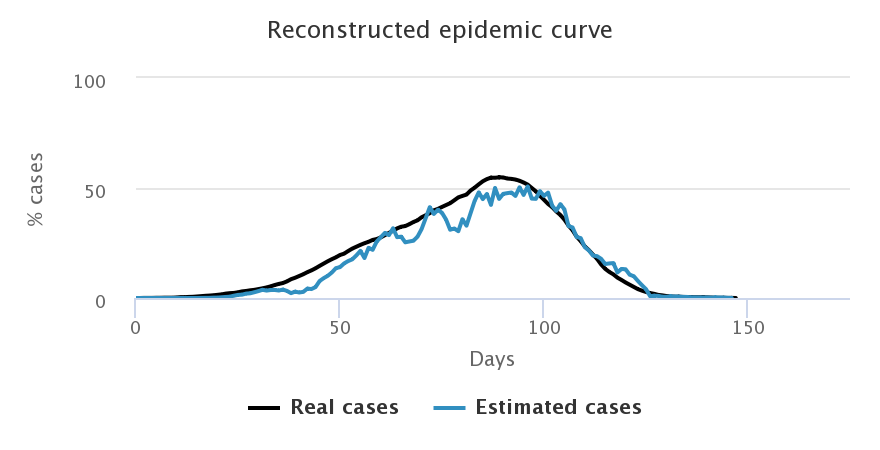
Let us now look at what happens when we choose to increase the number of daily tests: we start with 3 tests for 2,000 peoples on the top left corner, then up to 6 tests for 2,000 on the top right corner, then 9 for 2,000 at the bottom. Simulations were done on the random sample only, with a beginning of the testing campaign as soon as the first case appears. The following figures show only the estimation by predictive values since it is better than the proportionality method.
| 3 tests for 2,000 people | 6 tests for 2,000 people |
|---|---|
| 9 tests for 2,000 people | |
|---|---|
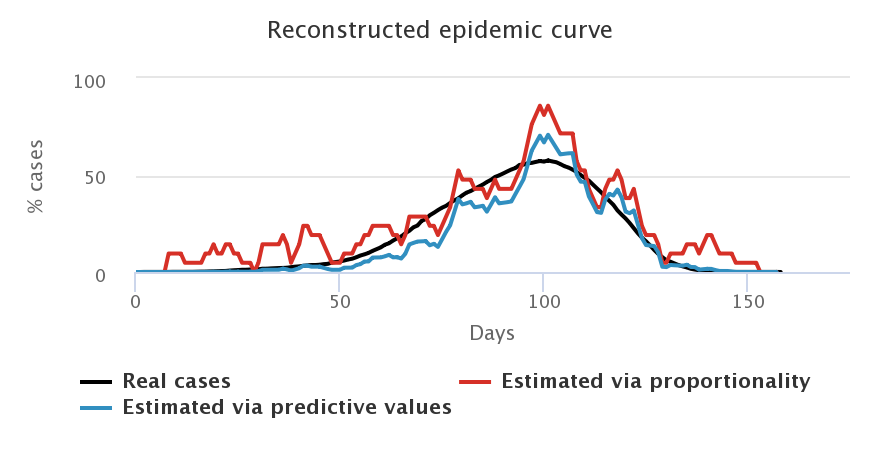
We notice that the higher the number of tests, the better the estimation of the number of cases in the general population. After an initial overestimation, when there are very few cases in the population and very little tests performed, the reconstructed curve follows rather precisely the actual epidemic curve, in particular around the peaking time, the key moment of the epidemic.
Comparison given the activation of the testing campaign
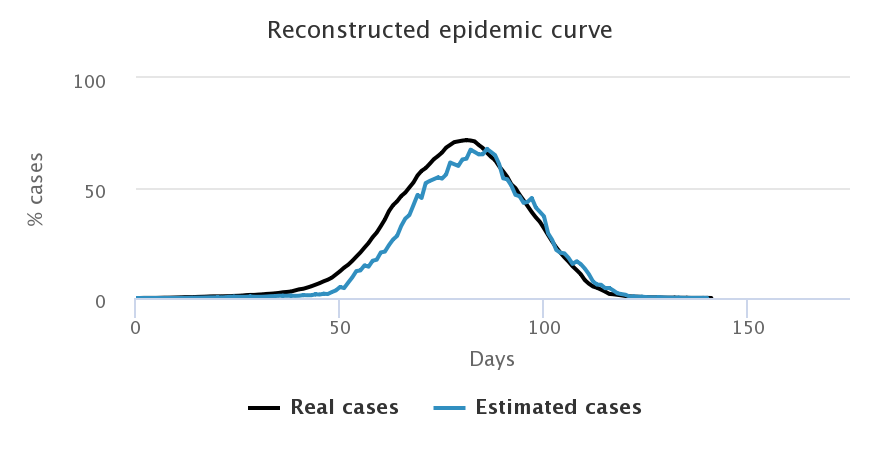
If we want for 15% of people to be infected to activate the testing campaign, the knowledge of the epidemic we get is strongly diminished, even if we ramp up the number of tests available daily. Simulations are run for the random sample.
| immediate start - 3 tests/2,000 | start at 15% - 3 tests/2,000 |
|---|---|
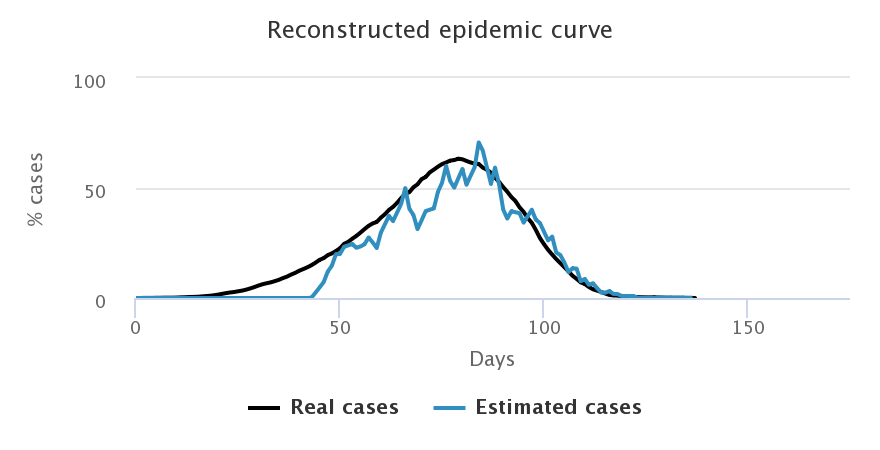
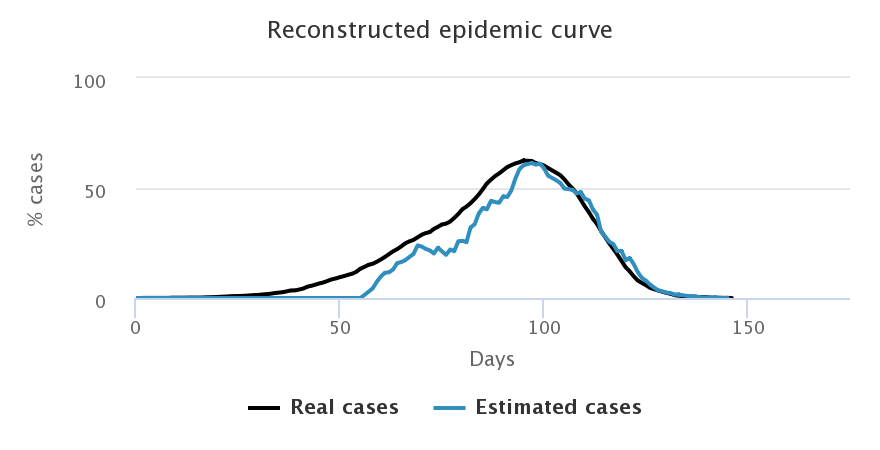
| immediate start - 9 tests/2,000 | start at 15% - 9 tests/2,000 |
|---|---|
We notice that with 3 tests for 2,000 people (first line), the reconstructed curve cannot capture the epidemic peak when we started the testing after 15% of infections (right hand side figure). Similarly, despite increasing the number of tests to 9 for 2,000 people on the second line, we notice that the peak identification is very uncertain and it leads to a strong overestimation of the number of cases once the peak is past (right hand side figure). This only happens when the number of cases is very low on the left hand side figure (when testing happens from the start).
Over to you
In the simulator below, we have several tools available to:
- Modify the number of tests available each day, and therefore the time necessary to test all the targeted population
- Modify the starting date of the testing campaign: from the start of the epidemic or later on
- Choose who is tested: people working outside of home, older people, people at random or people already showing symptoms of COVID-19
Your goals:
- To minimize the total number of tests used
- To minimize the spread of the epidemic: i.e. the total number of people infected
- To minimize the number of people quarantined for no reason, i.e. the number of false positive tests
- To follow at much as possible the “true” curve in order to monitor precisely the epidemic over time
Nota Bene To see the results of the optimal strategy obtained with an algorithm: Going further!
If the simulator window is truncated, try to zoom out.
Simulate different testing strategies
To conclude
We saw that organising testing is a complex question. It is important to start early, but designing a reliable test takes time and the first tests are not very informative (too many false positives / negatives).
Nota Bene For more information on the quality of tests and its importance in the estimation of case numbers: Going further!
It is necessary to test a representative sample of the population, but the constraints on the number of available tests lead to testing people who are most probably positive. This strategy offers the best control over the epidemic (testing and putting into quarantine all suspicious cases), but it leads to an overestimation of the number of cases in the population, and therefore towards a set of measures which are too restrictive.
As often, the truth is about finding the right balance.
Reminder: the models developed on this website are for educational purposes only. They are a lot simpler than models built and deployed by other teams working on COVID-19. They are not substitutes for these reference models and cannot be used to make diagnoses or forecasts. Our goal instead is to raise awareness about this epidemic and its drivers.