INTRODUCTION
Since the emergence of COVID-19 in Europe, the social characteristics of patients makes us wonder who is more affected. The virus originated in China.The first cases were “imported” either by Chinese nationals travelling overseas, or by foriegn travelers coming back home from China, then from the first other affected countries (Egypt, Iran, Italy…). It is no mystery that tourists and professionals traveling beyond Europe are mostly from privileged classes (diplomats, sales representatives, etc). (diplomates, commerciaux…).
In France, and in Paris in particular, one of the first instances of the epidemic was within the House of Commons, then in Cabinet. The media coverage over the infection of celebrities and royals in the world could suggest that COVID-19 was somewhat a “rich people disease”. The same analysis was made in the coverage of different national media outlets (in (Russia, Ukraine, but also Brasil, Mexico and Uruguay).
At the same time, many commentators stated that the virus was blind to socioeconomic differences. The Atlantic for example claimed, regarding Boris Johnson’s situation, that his infection illustrated the fact that the disease was universal, since it touched all groups of society regardless of wealth and size. Indeed, when the disease started spreading, all categories of population seemed affected equally, as the virus does not discriminate directly between its hosts in terms of social class or income.
However, the consequences of the disease are not the same for everyone. One’s state of health at the time of infection (co-morbidities especially), or one’s age make certain infected people more at risk and cause their symptoms to be more serious. Depending on the quality of life of the person infected, their professional activities or their usual mode of transport, “basic protective measures” are more or less easy to observe strictly. We can add the difference in access to healthcare and information, which vary significantly with the social status of people and their socialisation (as was shown for example in Sweden, where the spread of the virus was faster among foreigners who did not have access to information broadcasted in Swedish in the mainstream national media).
In this post, we present a model which illustrates the social and spatial spread of the virus among individuals from three social classes with distinct characteristics, and between different cities. The way the virus is transmitted from one individual to another is the same for all social classes: a close contact suffices (with a non-zero probability of transmission, as in the previous questions). However, the situations where people from different social classes come into contact with other people (and therefore can be contaminated) vary depending on elements which are directly linked to the social class they belong to. Social reality is very complex and social classes are defined along fuzzy and multiple lines, including levels of income and education. Here, we focus on only two elements, which we think have a particular role on the current epidemic dynamic:
- The geographical amplitude of usual professional activities (that is, roughly, the distance between home and work as well as the frequency of business trips) and the fact that the person can work from home or not in case of a lockdown.
- The residential situation:
- regarding the main residence: in collective or individual housing.
- the possibility to use a secondary residence in an isolated location. The difference induced during lockdown and its level of comfort and bearability are made stark and immediately perceived.
n general, the social position of people combines these two dimensions so that typically (and especially so in cities): the most privileged have a large geographical amplitude (they travel more often and further away, for business as well as for pleasure, etc.), they can work from home (as these first numbers about American cities by income level suggest), they reside more frequently than others in an individual housing setting, and own more frequently than others a secondary residence. Of course, there exists surgeons who live in collective housing and have to work on site, in the same way that some office clerks can work from their detached home. But on average and to simplify, we here define “privileged” people (represented by triangles) as those who can work remotely from an individual housing setting (a detached house for example). On the contrary, we define “working class” people (represented by circles) as those who cannot work from home (such as nurses, cashiers, police officers, cleaners, etc.) and who live in collective housing (typically, a flat). Their professional and residential settings mean that they can catch and transmit the virus when they go to work, but also when they come back home. Indeed, we assume that sharing a lift, a digicode or a communal bin cupboard, and interacting with neighbors makes the transmission of the virus possible at home. In our model, some individuals have an intermediary status (the “middle class”) and are represented by squares. They share a single characteristics with each of the two previous groups. For example, they live in collective housing but can work from home, or they live in a detached house but have to work on site. Their social position is intermediate between the privileged and the working class
DESCRIPTION OF THE MODEL
In the simulation, 1 working person (selected randomly) out of 2 has to keep working on site whereas the other half of people can work from home. If we add the weights of the health sector (7.1% of jobs), the social sector (7.4%), the commerce sector (12.9%), administration (9.1%), transports (5.5%) and finance (4.6%), we end up (for France at least), to roughly this figure of 50% of jobs having to be operated on site. Similarly, 1 person (selected randomly) out of 2 lives in individual housing whereas the other half resides in collective housing (this figure can vary greatly by city, region, country). If we combine these two dimensions, we obtain a simulated society where 1 in 4 on average is considered “privileged”, 1 in 4 is considered “working class” and 2 out of 4 are considered “middle class”.
The mobility of people operates on two scales: mobility within the city where people live (intra-urban scale), and mobility between cities (inter-urban scale). Indeed, some privileged people may work in a different city from the one where they live.
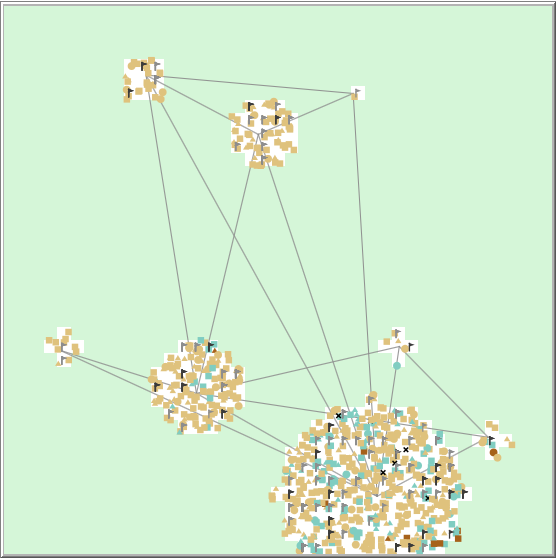
The model represents a typical region, where there is one big city and some smaller cities linked together by transport infrastructure which allows travel from one to the other. As in most countries, the bigger the city, the more densely it is populated (cf. Illustration below). For instance, there are approximately 4 people per patch in the big city and 1 person per patch in the smallest one.
Each day, a person can visit a maximum of 3 different locations:
- Their workplace. Workplaces are represented by:
- black flags for jobs which cannot be done remotely (for example: hospitals, waste management sites, supermarkets)
- grey flags for jobs in workplaces that will be closed during lockdown (some can be accessed virtually). We have reproduced in the simulation the “real-life” regularity by which workplaces are more concentrated in large cities than residence. Therefore, some people have to go to work in a city larger than the one they live in.
- The location of an additional activity (like shopping or going to the doctor), that is a public space where the person has to go, but which also corresponds to someone else’s non-remote workplace. Such locations are visited on average every four days. To simplify, we keep the same frequency of visits before and after lockdown, even though such a frequency must certainly be higher before the lockdown.
- The place of residence (in collective or individual housing).
Infection can happen in any of these locations, except home for people living in individual housing. People living in collective housing thus have an extra risk to get infected every day compared to other people.
At the beginning of a simulation, someone at random is picked to carry the virus. The model then represents the spread of the epidemic in the population.
When the threshold of 10 deaths is reached, a mandatory lockdown is imposed: everyone who can work remotely has to, whereas other people keep working from their usual workplace.
IS THE EPIDEMIC TRULY BLIND TO SOCIAL CLASS DIFFERENCES?
Let us look at the evolution of the epidemic in each social class of the population, by stopping the simulation regularly to update our view of the situation. After 35 days (the first series of graphs), the epidemic is still in its starting phace: on the left-hand side graph (“global epidemic situation”), the teal curve representing infected people is still below the beige curve representing susceptible people, and the number of people carrying the disease is not very high. When we disentangle this information by social class, we see that privileged people are proportionately more infected than others (the purple curve on the left-hand side graph is above the other curves) in this specific simulation, although it can vary depending on where the virus first appears (chance intervenes a little in the model as in reality). At this point, not many have died and there is no lockdown. If we look at where people got infected, we see that about a third (regardless of class) got it from going to work.
 Day 35
Let us run the simulation until day 70. Since we last looked, the threshold of 10 deaths has been crossed and lockdown has been imposed. We can now observe its first effects on the epidemic. Privileged people do not have to go to work anymore, and since they live in individual housing, they only have one opportunity to get infected: going to an additional activity every four days on average. Their infection level thus decreases very fast (right-hand side graph, purple curve). If the lockdown lowers the number of contacts made during the day for everyone, the amplitude of the decrease is not the same for each social class. Those who cannot work remotely and those who live in flats (and thus firstly the working class) still have several contacts a day and are increasingly infected by the virus (the green curve keeps going up and above the other two classes). They do not benefit as much from the lockdown.
 Day 70
At day 350 of this simulation, the epidemic is over. The proportion of infected people in the working class has been higher than the proportion of privileged people infected for about 250 says, with the middle class figure sitting in between. About 5.5% of all working class individuals have died, whereas it is less than 4% for privileged and middle class individuals. These figures can vary with the different simulations but the trend is always the same after the lockdown. Also, among those who got infected, less than 1 in 5 did because of work in the privileged class, whereas it is almost 3 in 4 in the working class.
 Day 350
OVER TO YOU!
As with previous questions on this website, a simulation allows you to explore the simulation for yourself. To set up the simulation, click on the blue banner below, and when you see the model’s interface, click “Initialise”. To start the simulation, press “Simulate”. You will see the graphs and the map change as time passes. The simulation will automatically cease when the epidemic is over. This can take several minutes.
If the simulator window appears truncated, just zoom out.
Simulate the impact of the epidemic on the different social classes
WHAT ABOUT SECONDARY RESIDENCES?
We heard a lot about secondary homes right after lockdown was imposed: it might have been authorised to use them as in Russia, or discouraged as in France, but many people fled the cities to isolate themselves in the country. Some early estimations.(based on mobile phone activity) suggest for example that Paris and its region have lost about 17% of their inhabitants. The media abundantly commented on the bourgeois populations who fled to their seaside homes, at the expense of risking the health of locals in touristic regions where the healthcare system is not calibrated for such a population increase. Of course, reality is more complex and the “Parisian exodus” includes secondary homeowners (from central Paris mostly) as well as students going back to their family homes, or people caring for family in other regions…
In the model presented here, we simplify the phenomenon as follows: we assume that people from the working class do not own secondary home, whereas 5% of middle class people and 10% of privileged people do (in France, 10% of housing units on average are secondary residences, although it does not mean that 10% of the population own a secondary residence, since some people own or co-own multiple properties. We keep the 10% figure for privileged people, and half of that number of the middle class). Secondary residences are located outside of cities, in isolation. Once people are confined in their secondary home, we assume that they do not come out anymore.
When clicking on “Secondary-houses?” in the lower left part of the simulator before initialising the model, you can see by yourself the impact of secondary residences on the spread of the epidemic…
The presence of secondary homes slightly reduces the number of infections, and therefore also the number of deaths, but only for privileged people. They always help to contain the epidemic, but only for privileged people (and parts of the middle class). The lockdown on the other hand benefits everyone by limiting all contacts in the population (cf. question 9), even though working class individuals benefit less from it than others because they still maintain contacts at their workplace and place of residence.
The virus is blind, but the chance of escaping it is not. When looking at two discriminating elements (residence and remote working), we see that the less privileged in society systematically pay a higher price in this epidemic. So we hope that the social redistribution measures will live up to the expectations…
It is (almost!) as simple as that.
NB. The question of social inequalities in the face of the virus is vast and all dimensions were not discussed here. Social variations in the use of public transportation, unequal comfort at home during lockdown, inequality in access to health care and to information play a very important role on the consequences of the current epidemic on society. These questions will be addressed in further publications. Stay tuned!
Reminder: the models developed on this website are for educational purposes only. They are a lot simpler than models built and deployed by other teams working on COVID-19. They are not substitutes for these reference models and cannot be used to make diagnoses or forecasts. Our goal instead is to raise awareness about this epidemic and its drivers.