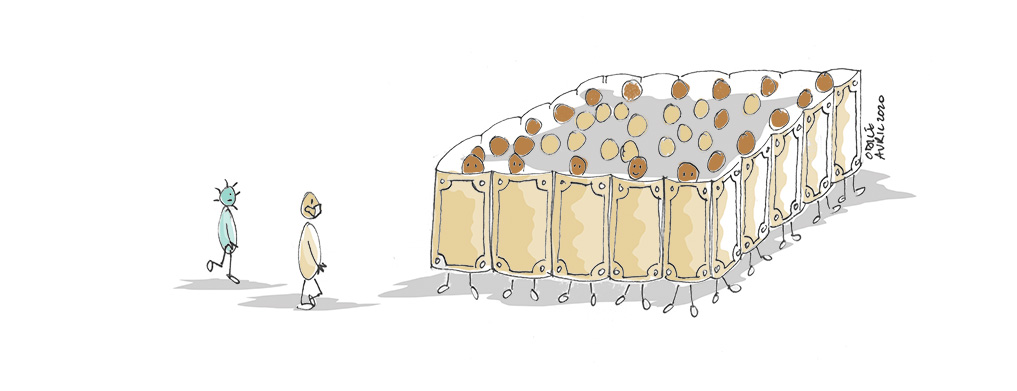
“Leave it be, leave it alone, the world stands on its own” said D. de Gournay (economist who introduced liberal thought in France in the 18th century). Let’s imagine that a pathogen (i.e. an entity that causes diseases, such as a virus or a bacterium for example) against which no vaccine is available emerges in a country. Suppose also that no mitigation measures are put in place to limit its spread: no border shutdown, no isolation of people, no testing or quarantine of infected people, etc. Then this country, by allowing this pathogen to circulate freely, will adopt, consciously or not, the strategy of herd immunity.
The idea is relatively simple: most pathogens circulating in a population immunize for a given period of time people who have been infected. Over time, it will therefore become increasingly difficult for the pathogen to find potential hosts in order to spread further. As a result, the population as a whole will be immune even if not every individual is. After the pathogen is gone, if the duration of this acquired immunity is relatively short (a few months or years) and with the renewal of the population through migration and births, the immunization rate in the population will gradually decrease. The risk of the same pathogen re-emergence leading to an epidemic will then increase.
A distinction must therefore be made between the immunization rate, which corresponds to the proportion of immunized persons in the general population, and the herd immunity rate, which is a threshold, a target to be met and calculated according to the pathogen’s specific characteristics. The herd immunity rate is a very useful statistical indicator to inform public policy, in terms of vaccination campaigns for instance: which proportion of the population must be vaccinated in order to achieve this collective protection against a pathogen?
To ensure that the spread of the pathogen is severely limited and does not cause an epidemic, the immunization rate must be higher than the herd immunity rate at the time the pathogen is introduced into the population. The risk of observing an epidemic reflux, i.e. a second epidemic wave, can also be inferred from this rate, based on the immunization rate of the population following a first epidemic wave. In the case of non-permanent immunity to the pathogen (as it seems to be for SARS-CoV-2), the immunization rate must be closely monitored and population immunity renewed in order to remain above the herd immunity rate at all times, and thus avoid a new epidemic.
Warning: herd immunity, as an overall statistical indicator, should not be used at the individual level to determine one’s own risk of being infected at a given location. It would be a reasoning error to calculate an individual risk from aggregated statistics.
A simplified world to understand herd immunity
In the following model, we create a population of 22,201 individuals represented by squares. These individuals can take on 3 distinct states: healthy, infected (and therefore contagious) or immune after having been infected. We assume immunity to be permanent here: the same individual cannot be re-infected by the pathogen. Each individual has exactly 8 “neighbours”. These are not really neighbours in the sense of “people who live next door”, but rather people with whom the individual can potentially come into contact over the course of a day (comparatively, a study conducted in 2008 found an average number of daily contacts equal to 13.4). In our model, healthy individuals can meet between 0 and 8 of their neighbours each day. Each encounter with an infected person carries a risk of transmission of the pathogen to the healthy individual.
Using this model, we will try to determine the herd immunity rate that will prevent an epidemic in our population, starting with a single infected person.
The following video shows the spread of the pathogen in the population. Healthy people are shown in beige, infected people in blue, and recovered and immunized people in brown. The proportion of initially immunized people is 0% in the top left video, 20% in the top right, 40% in the bottom left and 50% in the bottom right.
The figures below represent the evolution of the proportion of individuals in each category during the simulation, and correspond to the videos above, in the same order.
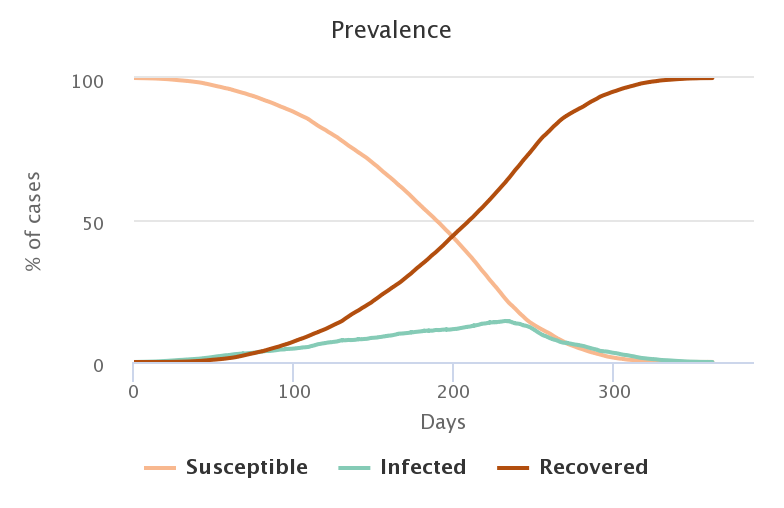
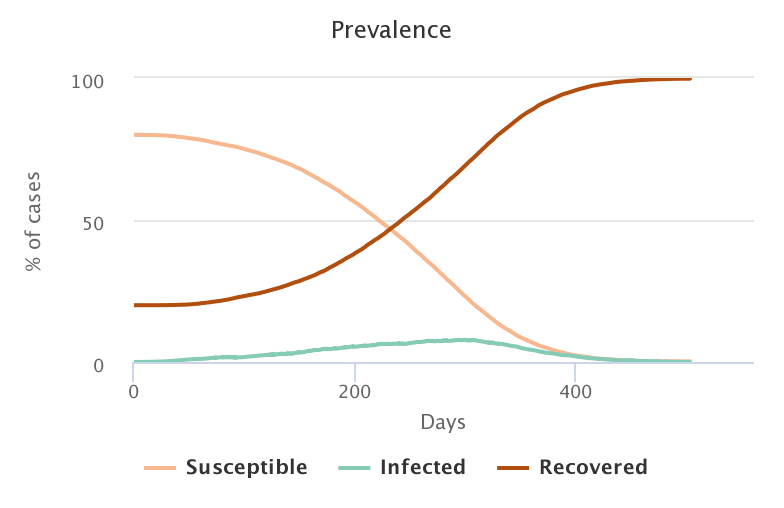
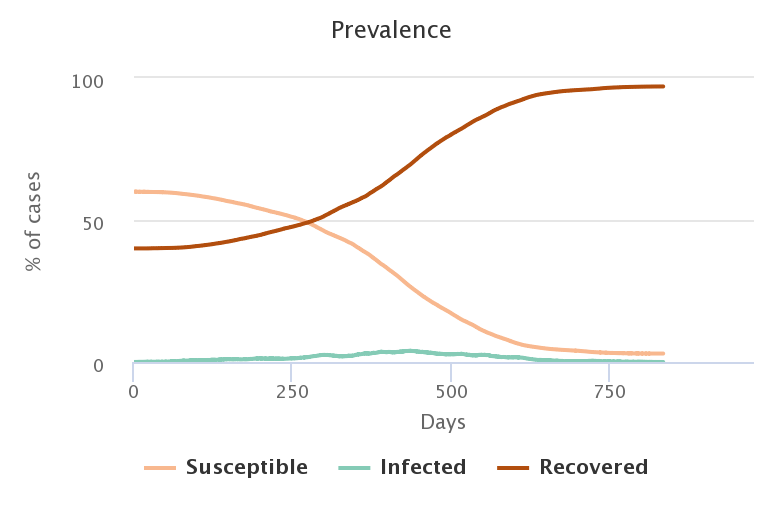
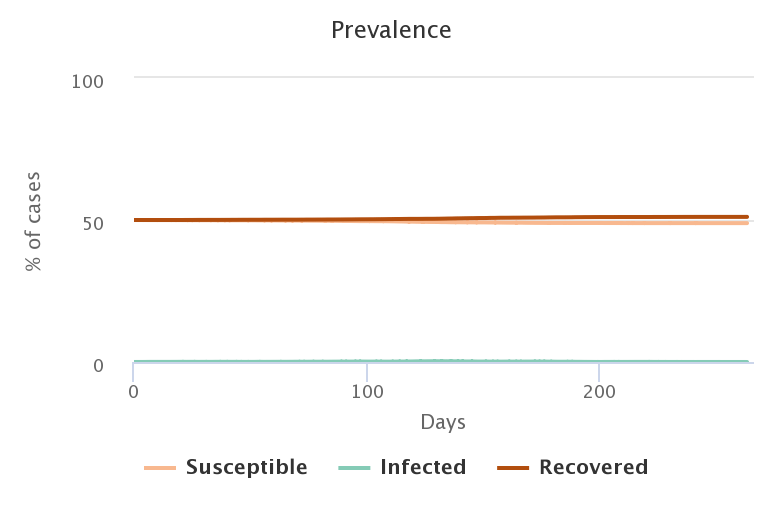
Unsurprisingly, the lower the rate of people initially immunized, the greater the number of people who became infected in the end.
| Initial proportion of immunized people |
Final proportion of infected people |
|---|---|
| 0% | 99.97% |
| 20% | 99.69% |
| 40% | 95.03% |
| 50% | 2.2% |
For the first three cases, we cannot speak of herd immunity since the immunity of 20 or 40% of the population does not protect the 80 or 60% who were healthy to begin with. On the other hand, if we increase the proportion of immunized people to 50%, then the spread of the pathogen from a single initial source of infection fails to turn into an epidemic: herd immunity is achieved and preserves a large part of the initially healthy population.
The search for this optimal marginal gain, which means that a small additional proportion of immunized people (10% more) can drastically reduce the number of new infection cases, is at the heart of the search for the herd immunity rate.
By plotting the proportion of infected persons at the end of a simulation (vertical axis) against different values of the initial immunization rate (horizontal axis), we can determine the herd immunity rate graphically. With the parameters used here, which are very favorable to the diffusion of the pathogen, the proportion of healthy people infected at the end of the simulation remains above 90% for immunization rates up to 40%. At 45% of people initially immunized, there is a slight decrease in the final proportion of infected people, but it remains very high at 77%. There is therefore no herd immunity in these cases. A significant threshold effect appears between 45 and 50% of immunized people: we see a sudden drop in the proportion of infected people from 77% to 14%! Thus, 5% more people immunized at the start leads to a decrease of more than 60% of the new cases recorded: herd immunity achieved! And by increasing the proportion of immunized people to 55%, we only get 1% of infection cases.
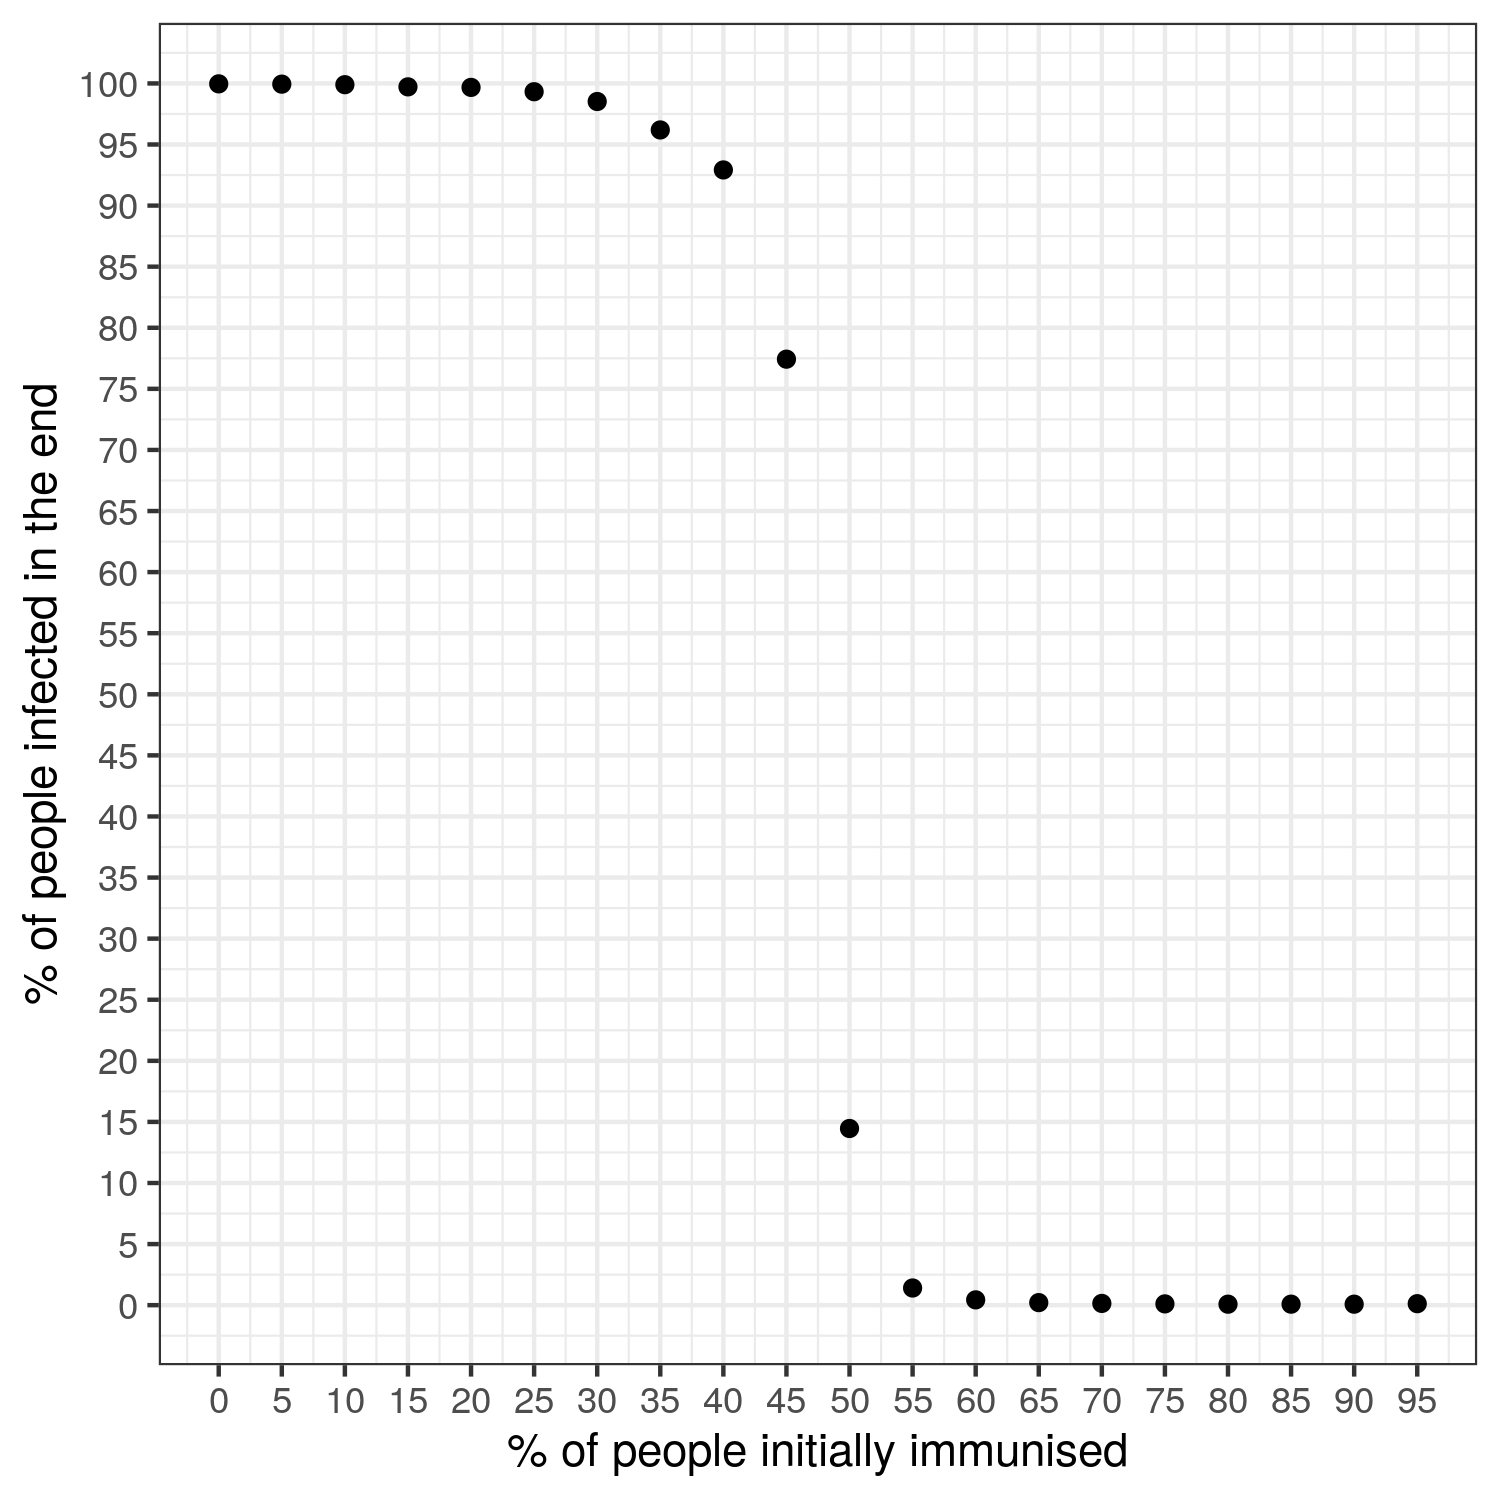
The figure above shows the average of the final proportion of healthy people obtained when the model is simulated 1,000 times for a given value of the initial proportion of immunized people.
The simulator: It’s up to you now!
Start by choosing the proportion of people initially immunized (between 0 and 100%), then select the way the population should be distributed in the world with the spatialised-world? parameter: either randomly (box unchecked), or spatially structured in East/West (box checked). Define the parameters values you want to test, then initialize the simulation by clicking Initialise.
Upon initialization, an infected case is randomly positioned in the area. Each time you click on initialization, a new spatial pattern appears. The Simulate button starts the simulation. Figures and counters are used to visualize the evolution of the health status of the population. Depending on the initial immunization rate of the population, the pathogen may not spread or may stop its progression. You can then decide to introduce one or more other infected cases (value to be determined by the cursor nb-new infections) and validate this choice (click on infect new people). You can also choose to create new cases during the simulation, for example to represent the importation of new cases. The following sections are examples of scenarios that can be tested with this simulator. For instance, you can observe how herd immunity varies as the transmission rate of the pathogen or the infectivity duration varies.
Warning: the model we present here is stochastic. This means that some of the mechanisms represented in the model have random effects. This is the case, for example, when the model is initialized: the choice of the individuals who will be initially immunized is random, as is the choice of the first infected person. This is why running the simulation several times with the same parameters values will always give different final values, even if they are close.
If the simulator window is truncated, try to zoom out.
Model simulating herd immunity
To learn more about herd immunity in general and the pitfalls to avoid, we invite you to click on the “Going further” button below. For more information on herd immunity during the current COVID-19 epidemic, another post is in the works!
Reminder: the models developed on this website are for educational purposes only. They are a lot simpler than models built and deployed by other teams working on COVID-19. They are not substitutes for these reference models and cannot be used to make diagnoses or forecasts. Our goal instead is to raise awareness about this epidemic and its drivers.