To slow the spread of a virus, different actions can be taken: promoting social distancing, closing schools, or reducing gatherings and travel for isntance. By slowing the propagation of the epidemic, these measures also help to ease the strain on the healthcare system.
Many journalists and politicians have relayed the idea of “flattening the curve” to justify the importance of social distancing or quarantine measures (cf #flattenthecurve on Twitter), in particular to avoid overloading hospital intensive care units (ICU). But why would flattening a curve be good news for hospitals, especially if eventually the same number of people become infected?
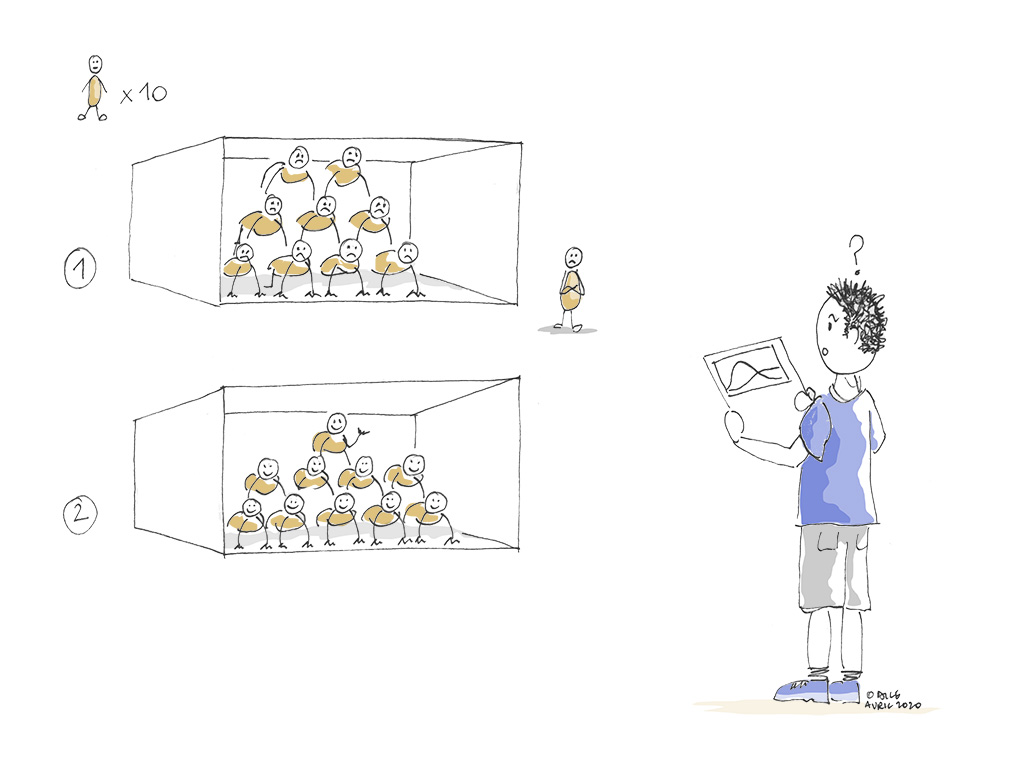
Actually, behind this desire to flatten the curve, there is the idea of stalling for time. The idea is to spread the number of infections over time by reducing the speed at which the virus propagates in the population, to prevent serious cases requiring hospitalisation from arriving all at the same time and exceeding the human and material capacities (number of carers, beds, equipment, etc.) of the hospitals.
Let’s start by studying the changes in the hospital overload according to whether or not the transmission speed of the virus is slowed down, with social distancing or a lockdown for instance.
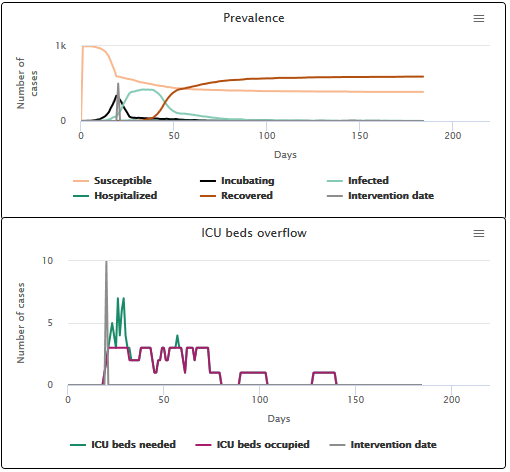
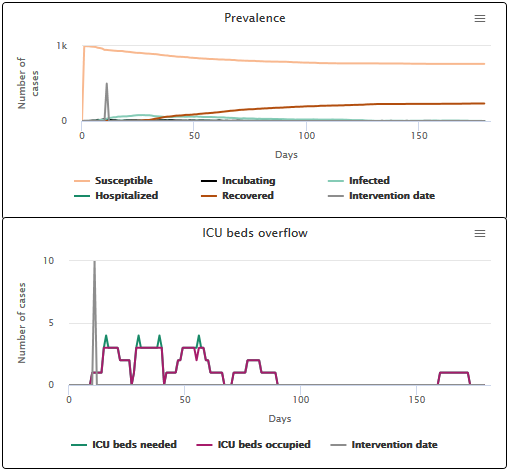
On the video below (scenario A1), we can see what happens if nothing is done to slow down the speed of transmission: a large epidemic peak occurs (in light blue on the “Prevalence” figure), and thus a strong need for ICU beds (the dark blue curve on the “ICU overflow?” figure). This need for beds is only partially met: for 19 days, the number of beds needed is larger than the number of beds occupied (purple curve). The difference between those two numbers represents the number of beds that are missing to meet the needs of the population. In fact, after the virus has disappeared, only 22.5% of people got the ICU bed they needed.
Scenario A1 No intervention on the transmission speed
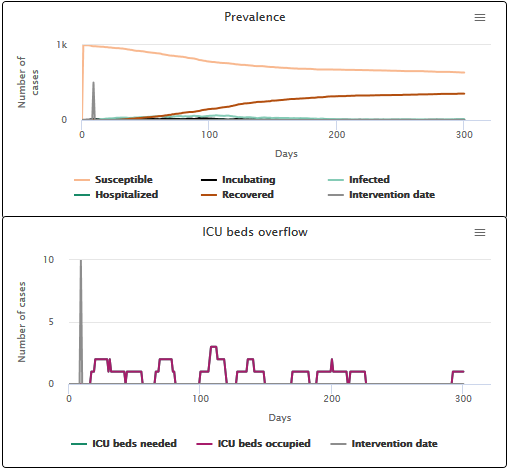
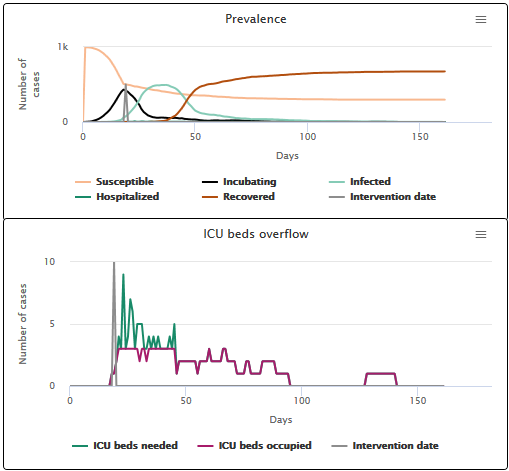
In the next simulation (scenario A2), transmission is slowed down as soon as the first severe case is hospitalized. In this case, a flattening of the epidemic peak occurs, as well as a decrease in the need for ICU beds. The hospital is overcrowded for a shorter period of time (9 days), and the proportion of individuals getting the ICU bed they need increases (43.8%).
Scenario A2 Slowing the transmission speed when the first hospitalization occurs
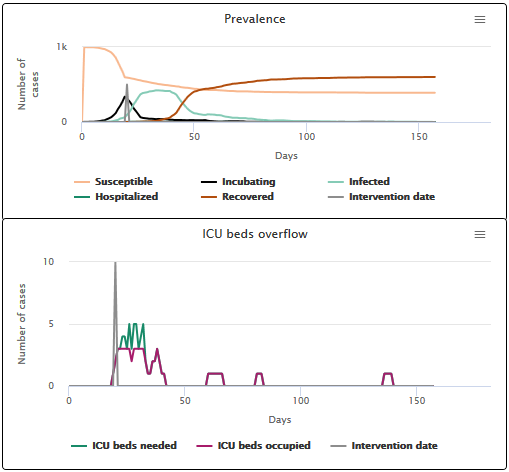
Finally, the last simulation (scenario A3) corresponds to the very idealistic situation where the epidemic could have been slowed down as soon as the first case appeared. In this case, the epidemic peak virtually disappears and we see no hospital overload: the curves corresponding to the number of beds needed and the number of occupied beds overlap. 100% of individuals who need an ICU bed get one.
Scenario A3 Slowing the transmission speed when the first infection case appears
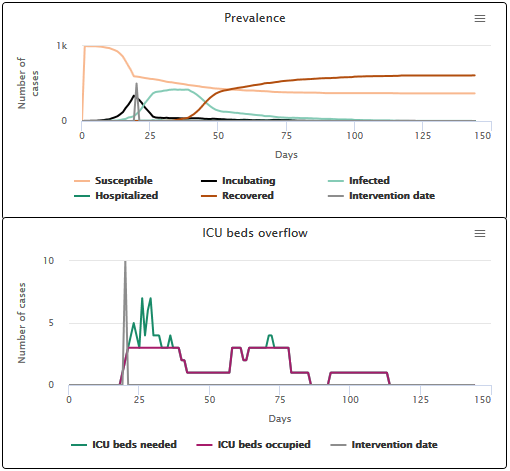
Depending on whether the transmission is slowed down earlier in the epidemic or much later, the epidemic peak and the hospital overload will not be “flattened” in the same way. This is why the flattening of epidemic curves is not the same in different countries depending on when the transmission speed was slowed down. It also shows why measures to limit transmission when introduced at the same time in a country can have varying impacts in different regions, depending on the number of people already infected locally at the time the slowing measures are enforced.
The simulations shown above use parameters that replicate what is currently known about COVID-19, in relation to currently available treatments. However, the propagation dynamics (and hence curve flattening) would not necessarily be the same for other viruses. The course and severity of the disease is unique to each virus, as shown in the diagram below.
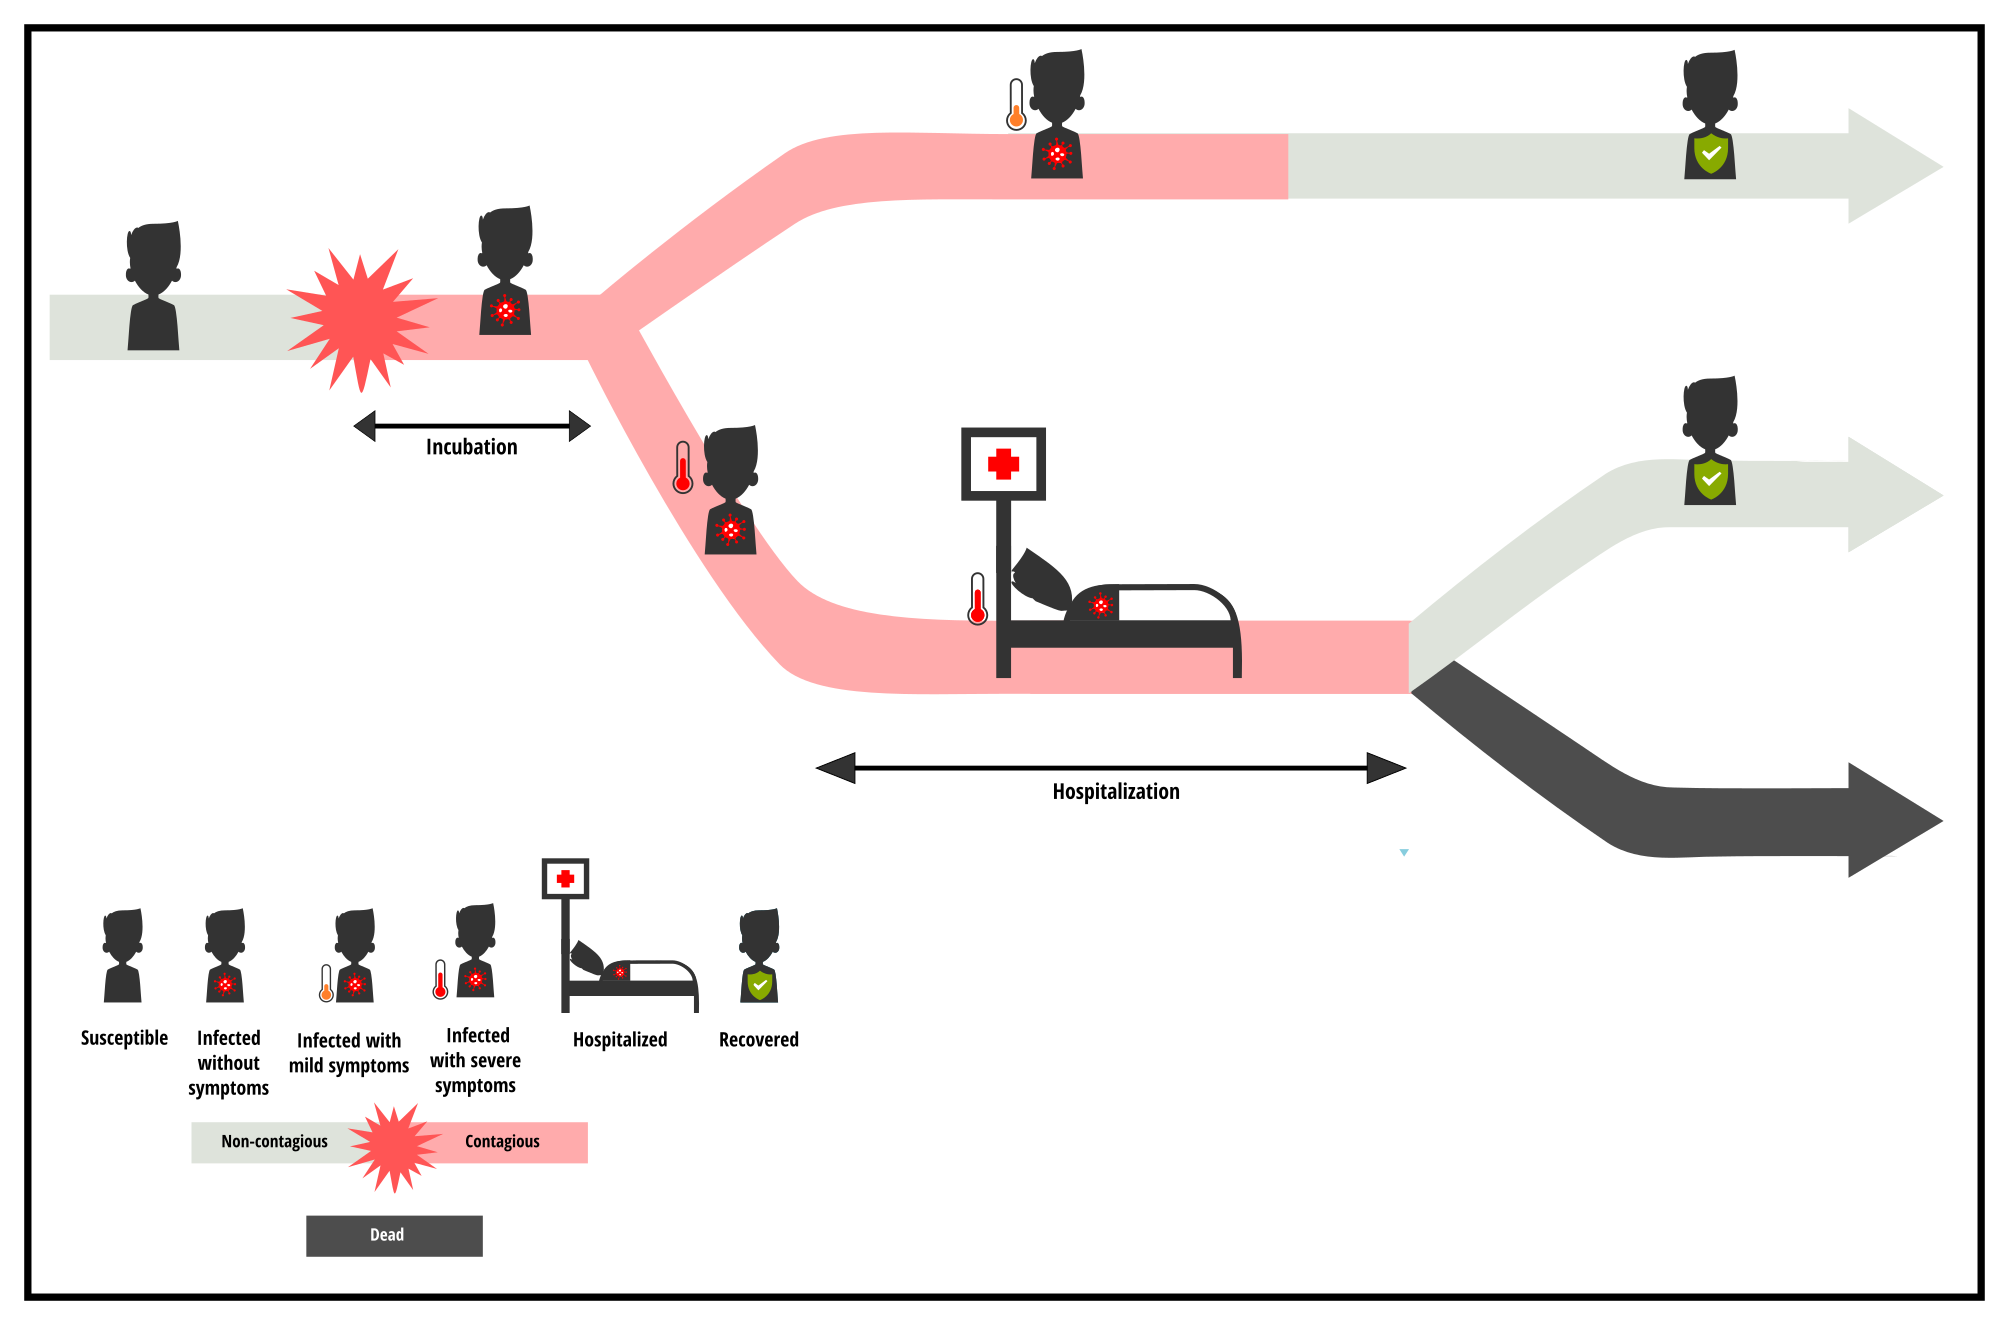
To assess the impact of slowing the transmission speed on the number of infections over time and on the hospital overload, the specific characteristics of each virus (and the associated medical care) must also be considered.
- First there is the incubation phase which is the period when the person is infected (and potentially contagious) but does not know it yet.
- Then, a hospitalization phase may be necessary for people whose health is deteriorating.
The respective durations of these consecutive phases depend on the virus. The date on which the infection is detected, the severity of the symptoms, and their duration vary and strongly influence the intensity and duration of the ICU overload in the event of an epidemic. Of course, other factors such as the number of severe cases requiring hospitalizatio,n or the number of available beds also have an impact on the pressure that the epidemic puts on the health care system, but let’s not focus on that for now. Let’s focus on the duration of the incubation and hospitalization phases, to see how these parameters impact the peak of hospital overload.
Firstly, imagine that we vary the incubation period (B) of the disease, for which the average duration has been set to 6 days by default in our models, based on what we currently know about COVID-19. How will the slowing down of transmission affect the hospital overload? We can see that when the incubation period of the disease is shorter (scenario B1 with an average incubation period of 2 days), reducing transmission from the first hospitalized case effectively reduces the ICU overloading: the hospital is only saturated for 4 days, with 76.5% of individuals getting the ICU bed they need.
On the other hand, if we choose a longer incubation period (scenario B2 with an average incubation period of 10 days), reducing transmission from the first hospitalized case does not allow us to avoid the ICU overloading. The ICU is overloaded for 13 days, and only 34.1% of individuals get the ICU bed they need. If the incubation period is longer, the infection has already had time to spread in the population before the reduction of the transmission speed takes place. This underlines the importance of the incubation phase (and the absence of symptoms that accompanies it) as a key factor in controlling an outbreak and containing hospital overcrowding.
Scenario B1 incubation phase duration of 2 days on average
Scenario B2 incubation phase duration of 10 days on average
Now let’s imagine that we vary the duration of hospitalisation in ICU (C), the average duration of which has been set to 12 days by default in our models, based on current treatments for COVID-19. We can see that the longer the severe cases require hospitalisation, the longer the hospital overload lasts. The number of people who require specialized care but cannot be treated is then higher.
- When the hospital stay is short (3 days), hospitals are saturated for 7 days and 67.9% of patients get a bed (see scenario C1).
- When the hospital stay is long (21 days), hospitals are saturated for 13 days and 26.7% of patients get a bed (see scenario C2).
This fairly intuitive result underlines the fact that the dreaded hospital overload currently observed with COVID-19 is closely related to the length of hospital care that this disease requires.
Scenario C1 hospitalization phase duration of 3 days on average
Scenario C2 hospitalization phase duration of 21 days on average
To compare the different scenarios, we focused on the number of days for which the ICU was saturated, and the proportion of sick people who got a bed. However, these values are dependent on the model parameters and must be interpreted relatively to each other. What is important here is to show to what extent and when hospital saturation occurs.
Reducing the transmission speed of a virus helps to relieve the health care system. But the effectiveness of this measure varies depending on when the speed of transmission is reduced, how long the disease spreads silently without being detected by the surveillance system, and how long the sick require care. Now you have a chance to experience this by playing with the model, with the objective of limiting hospital overload.
If the simulator window is truncated, try to zoom out
Model to simulate hospital overflow
Note: Tools built by other teams also aim to simulate hospital overload, for example Modeling COVID-19 Spread vs Healthcare Capacity
Reminder: the models developed on this website are for educational purposes only. They are a lot simpler than models built and deployed by other teams working on COVID-19. They are not substitutes for these reference models and cannot be used to make diagnoses or forecasts. Our goal instead is to raise awareness about this epidemic and its drivers.