Going further
Epidemic reflux
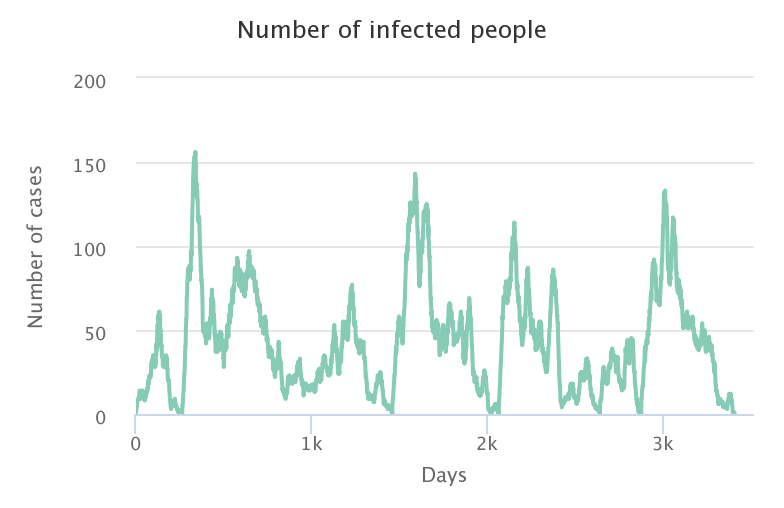
Starting from 50% of immunized people in the population, several new infection cases need to be introduced before an epidemic can occur again. The figure below shows the effects of introducing 5 new cases each time the epidemic ends (5 new introductions of 5 people): a new epidemic wave hits as long as the proportion of immunized people does not reach the herd immunity rate.
This result shows the importance of staying cautious during periods of high epidemic risk, even when the immunization rate of the population is high. Monitoring of the first identified cases, and treatment of potential contacts (vaccination or quarantine) remains a widely used means of limiting local rebounds of an epidemic.
The importance of regional epidemiological studies
In the previous simulations, we imagined population immunity to be randomly distributed in our territory, according to a vaccination-type scenario. We could imagine an acquired immunity that is spatially structured, the pathogen having for instance circulated in the area to the East of the simulation space. The question is then to determine the conditions under which an epidemic could start again, knowing that the immunization rate is relatively low at the level of the general population (28% for example), but spatially structured (with 56% of the population in the East being immunized, versus 0% in the West).
To carry out this experiment, the initial proportion of immunized people in the simulator must be lower than 50% of the total population. Indeed, this population will be distributed in the Eastern area only, thus in half of the world. In the previous example, this means that 56% of the population in the Eastern area is immunized, which gives an immunization rate equal to 28% in the global population. Try several initial configurations with the same parameters to observe the effects of locating new cases in the area of high or low immunity on the spread of the pathogen.
In the video below we have simulated four different scenarios:
| 20% immunized first case East | 30% immunized first case East |
|---|---|
| 20% immunized first case West | 30% immunized first case West |
|---|---|
When the first case appears in the Western area (bottom two videos), the pathogen spreads rapidly because it does not encounter any immune individuals. On the other hand, when it reaches the “virtual border” created by the group of immunized people, its progression slows down drastically and may even stop, depending on the immunization rate in the Eastern area. In the bottom left video, the spread of the pathogen is slowed down but the majority of the Eastern population is still infected in the end, while in the bottom right video, the spread of the pathogen is stopped very quickly at the border: herd immunity has protected the Eastern zone!
When the first case appears in the Eastern area (two top videos), the pathogen spreads quietly at the beginning of the simulation, propagation is quite slow. However, if the immunization rate of the Eastern zone is not high enough to meet the herd immunity threshold (top left video), the pathogen spread will dramatically increase as soon as it reaches the Western area where there are no immunized individuals. If the immunization rate of the Eastern area is over the herd immunity rate (top right video), then the pathogen disappears before reaching the Western area: the herd immunity of the Eastern area protects both the East and the West!
In conclusion, just because one part of the population appears to be better immunized than another does not mean that it is necessarily immune to infection, other factors come into play and must be monitored to control the epidemic risk.
Why a different rate for each pathogen?
Herd immunity is closely related to the “ease” with which a pathogen can circulate among individuals in a population. This “ease” depends on many factors, such as the mode of transmission from host to host (direct or indirect contact, vector-borne, etc.), the survival of the pathogen outside the host (on clothing, furniture, etc.), the duration for which the host is contagious, etc.
In the model we developed, we used three main factors that influence the herd immunity rate: the number of contacts per individual, the success rate of transmission during a contact, and the infectivity duration. The number of contacts per individual depends on the structure of our model (here, a maximum of 8 contacts per day), but the other two parameters vary depending on the pathogen we want to represent. This is why the herd immunity rate needed to meet and protect the population will be different from one pathogen to another depending on the values of these parameters. These parameters are related to the famous basic reproduction number, or R0, which has been the subject of a post on our site.
Below are some examples of the values of these parameters for several known diseases:
| Pathogen | Transmission rate | Infectivity duration | Herd immunity rate |
|---|---|---|---|
| Seasonal influenza | 0.23 | 6 days | 70% |
| Mumps | 1.1 | 10 days | 85% |
| Rubella | 0.28 | 21 days | 90% |
| Measles | 1.9 | 8 days | 95% |
That is why the main epidemic control measures target these parameters: limiting contacts through social distancing or quarantine, limiting transmission by wearing masks and hand washing, and reducing the infectivity duration by testing and isolating infected people. To take into account the effects of these three parameters on herd immunity, we need to change the model to allow for a greater number of inter-personal contacts. We are working on it and the corresponding question should be online soon!
Reminder: the models developed on this website are for educational purposes only. They are a lot simpler than models built and deployed by other teams working on COVID-19. They are not substitutes for these reference models and cannot be used to make diagnoses or forecasts. Our goal instead is to raise awareness about this epidemic and its drivers.