With the information we have at hand, it is hard to answer this question succinctly, for example: if a healthy person and an infected person come in contact, the healthy one has n out of 100 chances to get the virus. It all depends on the nature of the contact, its duration, the viral charge of the carrier, etc.

This is an important and - apparently - simple question, which is hard to find a definitive answer to… and yet this is exactly what we need to feed our model of virus transmission.
However, what we do know is that R0 (or basic reproduction number) is high: its value is estimated to be between 2 and 3 according to specialists. This means that someone with the virus will transmit it to between 2 and 3 other people on average during the epidemic.
A group of French researchers has analysed the data of confirmed cases since the beginning of the epidemic and estimated that the basic reproduction number for COVID-19 was initially close to 2.5 for France. They note that “as a benchmark, the number is generally closer to 1.5 for the seasonal flu. The high value [for COVID-19] is probably due to the fact that, unlike flu, there is no pre-existing immunity in the population”.
The way forward regarding the calibration of the model (i.e. its alignment with empirical values) is to look for a probable transmission value between individuals (between 0 and 1) which is consistent with this R0 (between 2 and 3) estimated globally.
This precise question will be explored in a future post, and so will the question of immunity. What we’ll focus on here is the influence of this inter-individual transmission probability on the speed of transmission of the virus in a population of healthy people (let’s remember that we are dealing with a new disease that nobody, by definition, is immune to).
The best way to answer this question is to take our initial model from question 1 and to run it several times, with different values for this interindividual transmission probability.
The results can be represented on a graph, in order to get a global view of the process.
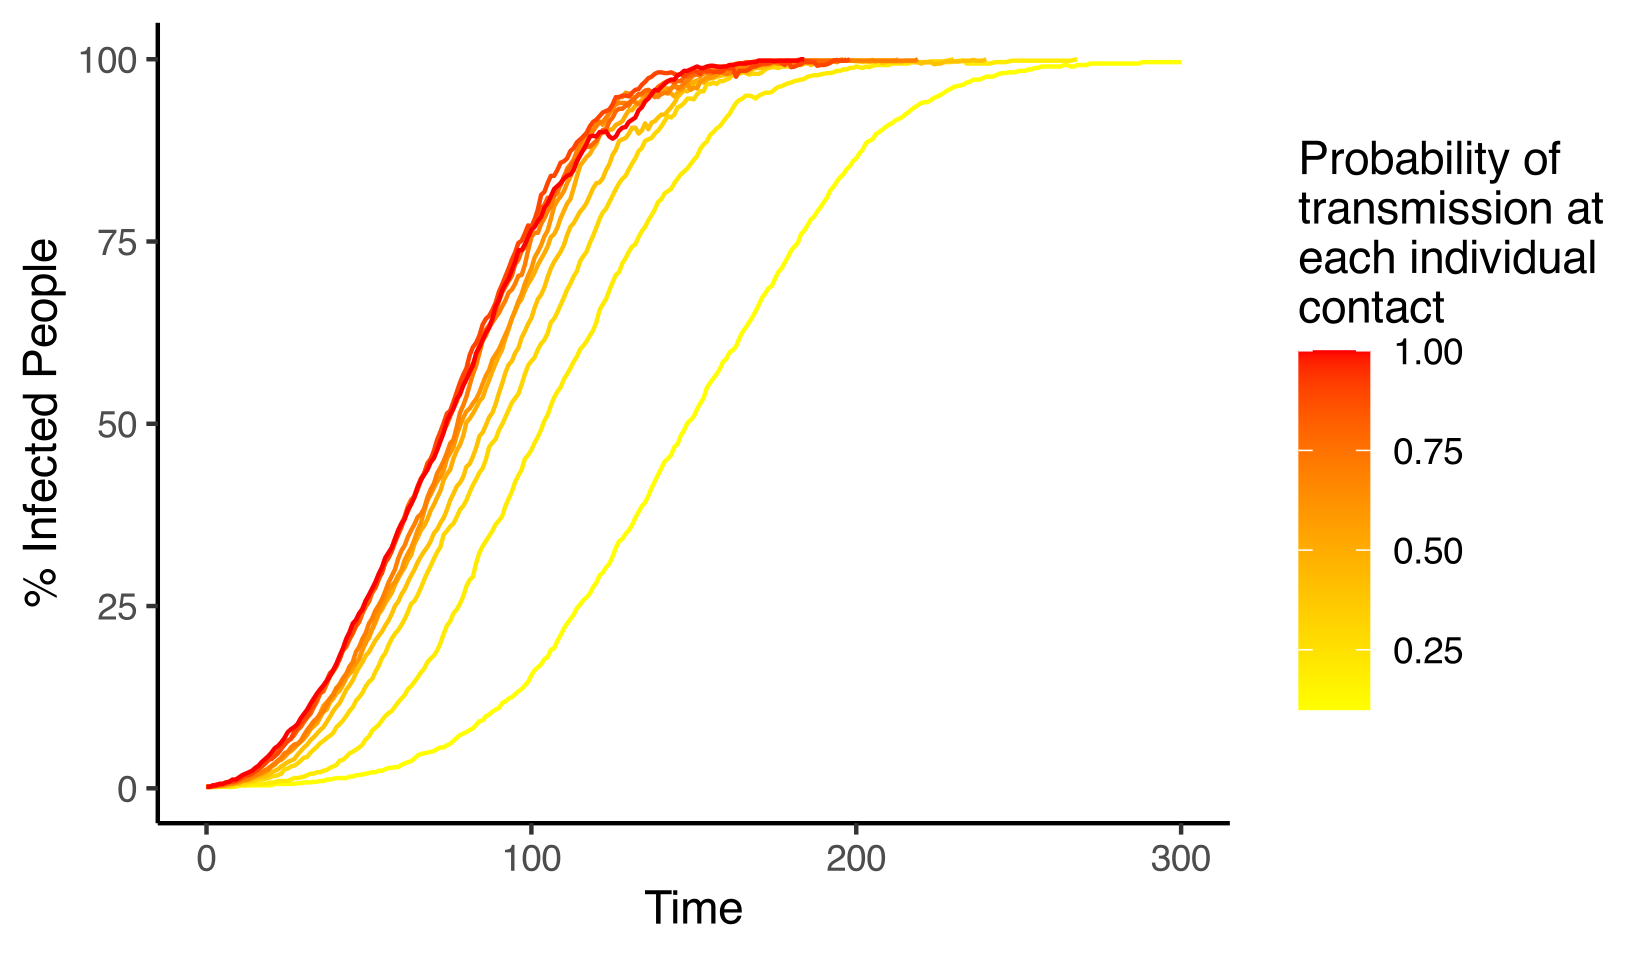
This graph shows the spread of the epidemic, from start (a single infected person) to finish (everybody is infected). Each curve corresponds to a single simulation, with a different value of transmission probability. In red are the curves for where this value is close to 1, and in yellow are those where the value is close to 0.
We find that this transmission probability (which can be seen as a proxy for the contagiousness of the virus) has a direct impact on the spread of the disease in a population without immunity. Logically, higher values of R0 (in red) correspond to earlier and faster epidemic waves.
By contrast, only very low values of transmission probability can really slow down the progress of the epidemic (the yellow curve on the right)… hence the importance of basic protective measures!
It is as simple as that.
Artistic (scientific) representation of the epidemic wave for different values of contagiousness of the virus.
Reminder: the models developed on this website are for educational purposes only. They are a lot simpler than models built and deployed by other teams working on COVID-19. They are not substitutes for these reference models and cannot be used to make diagnoses or forecasts. Our goal instead is to raise awareness about this epidemic and its drivers.